 Nuvo Platform
 Nuvo Intelligence
 Customer Onboarding
 Portfolio Management
 Vendor Onboarding
 Accounts Receivable
 Alcohol & Beverage
 Apparel
 Building Materials
 Chemicals
 Distribution
 Food Service
 Heavy Equipment
 Manufacturing



Loading
Welcome to the B2B Trade Briefing, your monthly report on the credit and trade data shaping the physical goods economy.
Each month, we analyze millions of data points across the B2B trade lifecycle flowing through Nuvo's network of 175,000+ businesses. Using data that spans onboarding, credit, AR, and payments, we surface benchmarks and patterns for credit and finance leaders to action against.
While most data surrounding B2B trade is outdated, anecdotal, or both, we aim to give you an honest read on what's happening in your industry (think: approval rates, fraud patterns, terms being extended, and where demand is moving) and to back it up with the numbers.
Wine & Spirits application volume rose 47.6% in May, creating the largest single-month volume jump of any industry on the platform this year. It also extended a streak that has now run unbroken since January: Wine & Spirits is one of only three industries to post volume gains every month of 2026.
The macro backdrop helps explain May, specifically.
The beverage & alcohol supply chain spent much of the spring absorbing a rapid sequence of tariff changes: A court ruling in early May struck down a broad import tariff that had been weighing on European wine and spirits importers, but within 24 hours, a replacement levy of 15% was announced under separate statutory authority.
Section 122 tariffs, which currently sit at the statutory ceiling, are set to expire in late July unless extended, an outcome most observers consider unlikely. That combination (relief followed immediately by a new rate, with a potential expiration window in view) is exactly the environment that pushes distributors to move. Opening new supplier credit lines, locking in terms before the next policy shift, and expanding sourcing optionality are all rational responses to a supply chain where the cost structure can change with little warning.
May's median approval time ticked up slightly month-over-month, to 1.7 days from April's 1.2-day record low. On its face, that looks like a step backward, but we don’t think it is.
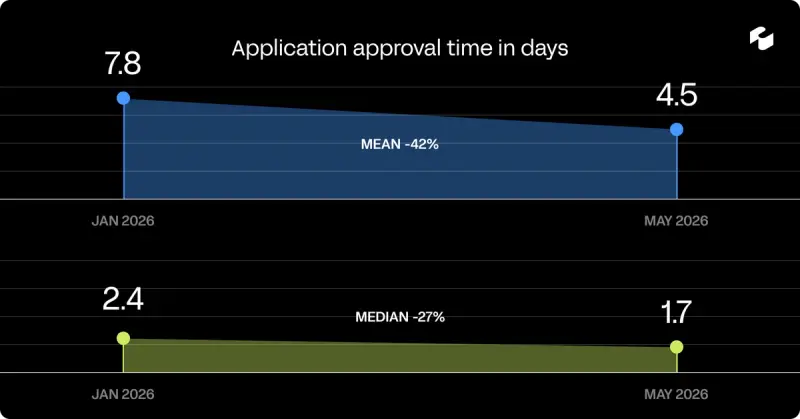
For credit leaders, the median is useful as a baseline, but the mean is the number that reflects operational health across the whole team. A median that holds steady while the mean falls shows progress for the whole platform, not just for a few outlier suppliers.
The platform-wide approval rate fell to 76.2% in May, a year-to-date low. The automotive industry was the primary driver: Approval rates in the segment dropped from 70.9% in March to 46.1% in May, with rejections actually outnumbering approvals on thousands of applications.
Nearly all of it traces back to a single large automotive distributor. That one customer accounted for 98% of automotive rejections in May, using a uniform templated denial across the vast majority of their decisions. Excluding that distributor, the platform-wide approval rate held steady at approximately 85%, consistent with prior months.
There’s a separate observation buried in the timing data that could be of note: That same distributor processed applications on the very fast end of businesses on Nuvo. Ninety percent of their decisions (approvals and denials alike) landed within 72 hours, with a median turnaround of 41 hours. Compare that to the broader automotive segment median of nearly five days.
The lesson here isn't that speed produces rejections. It's that a well-configured decisioning process and strong credit policy produces decisions quickly, consistently, and at scale. The distributor in question has clearly invested in the infrastructure to move through a high volume of applications without delay.
Platform-wide application volume actually contracted in May, with total submissions falling 8.3% from April, driven by a pullback among established suppliers. But underneath that headline, three industries have been on an unbroken climb since January, with volume gains in every single month of the year.
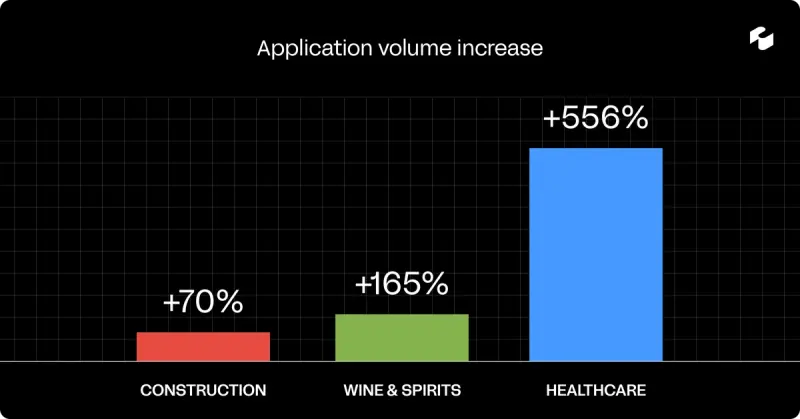
Healthcare's growth is the steepest, though it starts from a small base. Wine & Spirits combines meaningful absolute volume (with thousands of applications year-to-date) with a clean upward trajectory. Construction is the least explosive of the three, but its 70% growth over five months on an already-large base reflects something durable about where trade credit demand is moving in the physical economy.
For suppliers in these verticals, the compounding effect matters. More applications mean more data, more benchmarks, and faster, better-informed decisioning for everyone in the network. A Wine & Spirits supplier onboarding a new buyer in May is operating with significantly more reference data than one who ran the same process in January.
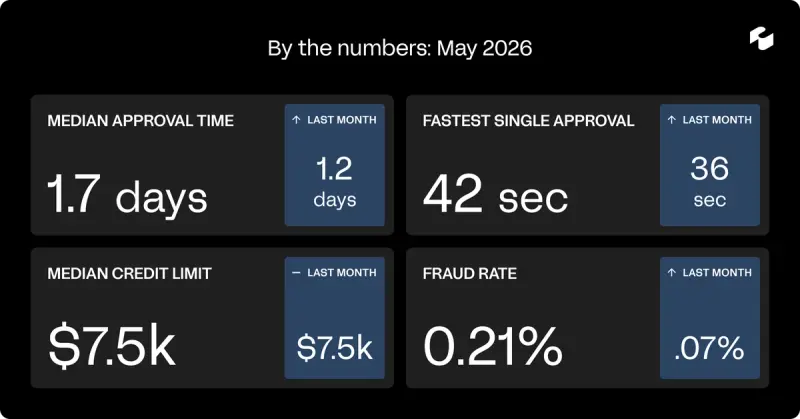
This report is based on anonymized, aggregated data from across the B2B trade lifecycle flowing through Nuvo's network of 150,000+ businesses. All figures reflect network-wide trends we're seeing spanning onboarding, credit, AR, and payments from the Nuvo platform.